
WHAT IS AQHI AND HOW IS AIR QUALITY REPORTED?
PRAISE-HK uses the Air Quality Health Index (AQHI), developed by the Hong Kong Environmental Protection Department (HKEPD), to report the current and forecasted air quality for the next 48 hours.
The AQHI is developed by first calculating the sum of the percentage added short-term health risk (%AR) of daily hospital admissions attributable to the 3-hour moving average concentrations of ozone (O3), nitrogen dioxide (NO2), particulate matter (PM), and sulphur dioxide (SO2).
The total sum of the %AR of the four pollutants are then converted to 11 AQHI bands and 5 Health Risk Categories:
| Health Risk Category | AQHI Band | %AR |
| Low | 1 – 3 | %AR <= 5.64 |
| Medium | 4 – 6 | 5.64 < %AR <= 11.29 |
| High | 7 | 11.29 < %AR <= 12.91 |
| Very High | 8 – 10 | 12.91 < %AR <= 19.37 |
| Serious | 10+ | %AR > 19.37 |
About Hong Kong's annual AQHI
WHAT IS PRAISE-HK?
PRAISE-HK stands for Personalised Real-time Air-quality Informatics System for Exposure in Hong Kong. It is a smart city app that provides state-of-the-science real-time and forecasted (up to 48 hours) air quality and health risk information down the street where you are located.
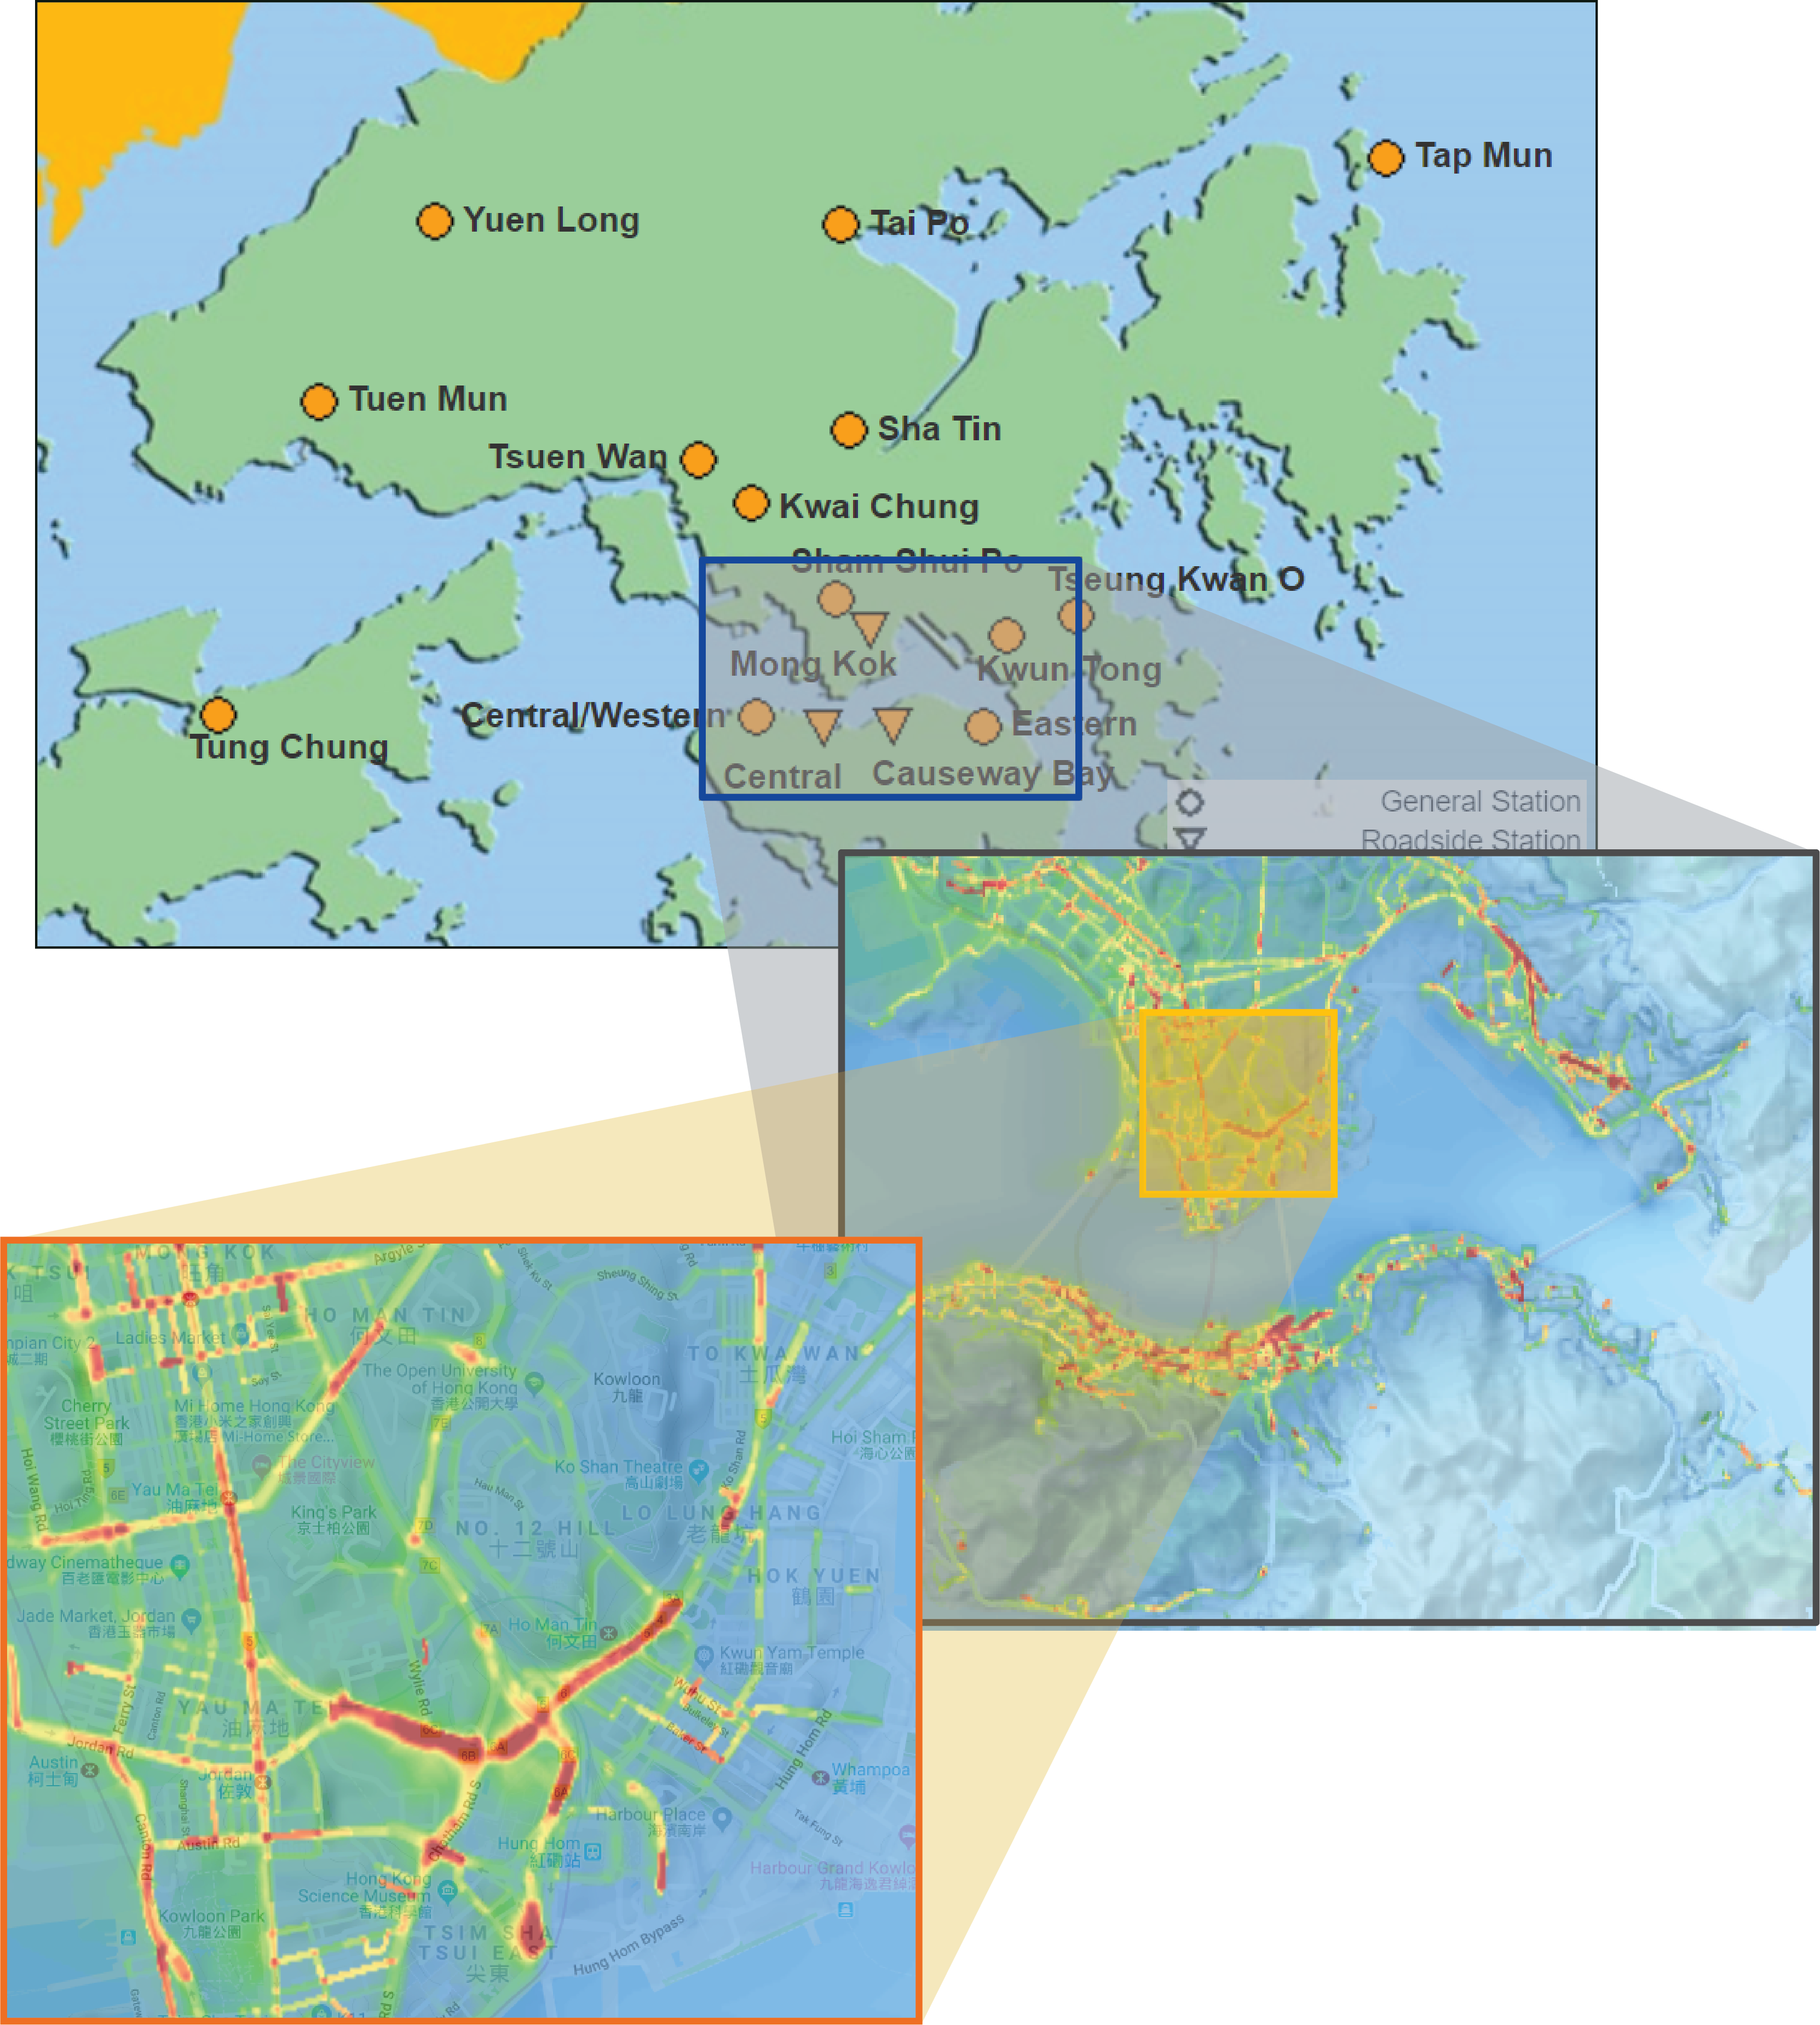
The resolution of the air quality and health risk information vary, ranging from the finest resolution of two meters (2 m) along the urban road network to the lowest resolution of twenty meters (20 m) in rural areas over Hong Kong.
WHY PRAISE-HK?
Hong Kong’s official air quality monitoring network, limited to a small number of monitoring sites and designed to depict the average air quality over different districts, cannot show the fine scale street-to-street variations of air quality. This may give the public an impression that there is a little variation of air quality in the city, and that there is not much they can do to avoid highly polluted areas.
However, the air quality can actually vary widely from one street to another in dense urban cities like Hong Kong as a result of the difference in traffic and ventilation conditions. The goal of the PRAISE-HK mobile app is to empower the user with street-to-street air quality information, so that he/she may make more informed decisions about his/her daily activities.
PRAISE-HK APP USER INSTRUCTION
AIR QUALITY AT YOUR CURRENT LOCATION - HOME SCREEN
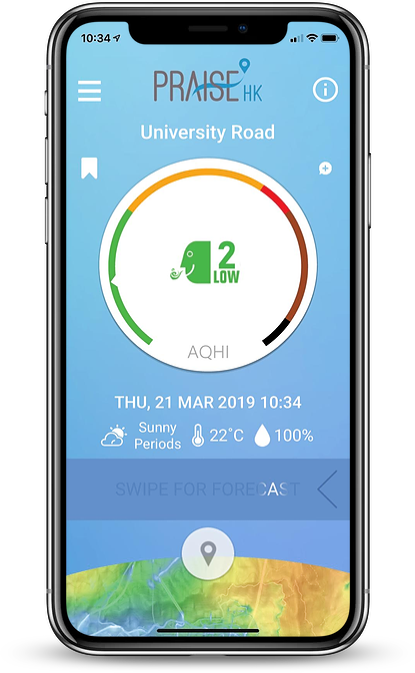
The home screen shows the current AQHI at your GPS identified location.
- check the %ARs contributed from the different pollutants by tapping the AQHI display;
- check the health advice for the reported AQHI by tapping the “heart icon”;
- check the AQHI values at your bookmarked locations by tapping the “bookmark icon”;
- check the 48-hour AQHI forecasts at your location by swipe the forecast bar to the left;
- check the street level air quality map around you by tapping the “location icon
 ”;
”; - tap the burger menu
 to get a menu list of possible action items.
The PRAISE-HK app is designed for showing the fine-scale air quality variations in Hong Kong. If the user is outside Hong Kong, it will show the AQHI information of a selected location near the geographic center of Hong Kong.
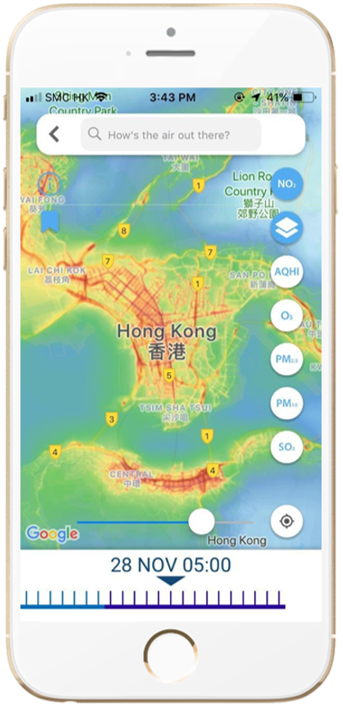
STREET LEVEL AIR QUALITY MAP
You can get to the Street Level Air Quality Map by tapping the “location icon![]() ” on the home screen, or the corresponding tab on the menu list.
” on the home screen, or the corresponding tab on the menu list.
The Street Level Air Quality Map firstly shows the air quality distribution around you. You can:
- use the opacity bar to control the opacity of the pollutant map layer to better see the pollutant distribution or the underlying map display;
- swipe the “Forecast” slide bar to find out the pollutant distribution at other forecast hours;
- tap the “pollutant layer icon
 ” to change the displayed distribution from %AR, to AQHI and other criteria pollutants (NO2, O3, PM2.5, PM10 and SO2);
 - pan to relocate the map display area;
- zoom in to look at more fine-scale variation of air quality around you;
- zoom out to look at more at the large-scale distribution of air quality around you;
- drag the map to select any location or input a location at the search bar to find a particular place, and its corresponding AQHI will be shown in a display box. You can then touch the display box to check the pollutant concentrations and %ARs, or tap:
- “Bookmark
 ” icon to save the selected location as a bookmarked location. This location will be saved to the list of “Saved locations”, and the bookmark icon will change from empty to filled. If the location has already been saved, clicking “filled bookmark
 ” icon will bring you to the “Saved Locations” screen.
 - “Forecast” tab to show the AQHI, %AR and pollutant concentration forecasts;
- “Health Advice” tab to health advice corresponding to the %AR;
- “close
 ” icon to remove the AQHI display box.
- “Bookmark
SAVED LOCATIONS
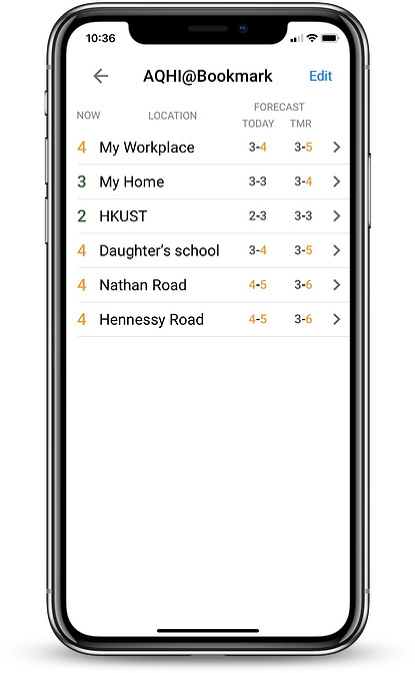
Following instructions on adding “bookmarks” in the “Street Level Air Quality Map” section, you can bookmark places you or your family often visit in your list of “Saved locations” and find out their current and predicted air quality with a single tap.
You can go to the “Saved Locations” screen by tapping the “Bookmark![]() ” icon on any screen, or select the corresponding tab on the menu list. The current AQHI and the forecasted range of AQHI for the rest of today and for tomorrow for all your saved locations will be tabulated.
” icon on any screen, or select the corresponding tab on the menu list. The current AQHI and the forecasted range of AQHI for the rest of today and for tomorrow for all your saved locations will be tabulated.
You can also:
- tap on any location name to go to the street level air quality map around that location;
- tap on the forecast of any location to get the detailed 48 hour forecast of that location;
- reorder the list of saved locations;
- go to the Edit screen for any saved location by tapping the “>” icon on android phones OR swiping left over the “>” icon and tapping the “more” on Apple iphones. On the edit screen, you can
- change the name of the bookmarked location;
- enable or disable push notification for that bookmarked location;
- set the alert level for push notification for that bookmarked location; if alert is enabled for a location, a notification will be generated if the AQHI is forecasted to be higher than or equal to the selected alert level in the next 3 hours. To avoid excessive alerts generated during bad air quality days, only one notification will be generated per day per saved location.
FORECAST VIDEOS
For users interested in going under the hood to better understand the PRAISE-HK system, you can see the different layers of predictions in the derivation of the AQHI products by choosing the “Forecast Videos” tab on the menu.
The AQHI prediction at four spatial scales are shown in four panels. These videos show clearly the interactions between pollutant emission (over land areas) and their transport by the weather systems.

Starting with the top left panel, which shows the results of a model covering much of Asia at 27 km resolution; this model try to take into account the changing weather system in the next 48 hours, and the transport of pollutant from different part of Asia into our neighbourhood region in the Greater Bay Area. High AQHI levels are represented by black, brown and red, and medium to low AQHI levels are shown in orange and green. Transport of pollutant from one part of Asia to another can readily be seen, and from time to time. These transport may bring the pollutants (and high AQHI) into Hong Kong. The 27 km resolution model predicts the background air quality variations over southern China.
Going clockwise, the top-right panel shows the result of an 1 km resolution model cover most of the Pearl River Delta and Hong Kong. Taking output from the 27 km resolution model and adding more detailed local emission information, this 1 km model predicts the background air quality variations over Hong Kong.
Continuing clockwise, the bottom-right panel shows the results of our street resolving urban dispersion model running at 2 to 20 m resolution over the entire Hong Kong. Taking the output from the 1 km model and running at street resolving resolutions, this urban dispersion model can take into account of the effects of local traffic density, wind characteristics, build morphology and street canyon trapping effects.
It is difficult to show street scale variations in a map covering the entire Hong Kong. Hence, the Kowloon Bay area was extracted and shown in the bottom-left panel at very fine resolution to show the street-resolving ability of the system.
Besides AQHI, you can choose to show the pollutant concentrations by selecting the individual tabs (NO2, O3, PM2.5, PM10 and SO2) at the top of the Forecast Videos screen.
You can also choose to display forecast videos of %AR, the percentage added short-term health risks. Instead of showing the total %AR for the four domains, we have chosen to show the %AR(total) in the top-left panel, and its components %AR(NO2), %AR(O3) and %AR(PM) for Hong Kong in the top-right, bottom-right and bottom-left panels, respectively. Theoretically, %AR(total) should also include %AR(SO2), but the SO2 term is usually very small and can be neglected.
By plotting the total %AR and its contributing components together at the same color scale, we hope to show the public which pollutant is contributing more to their air pollution percentage added short-term health risks. Overall speaking, for the %AR used in the AQHI, NO2 contributes most significantly to %AR at or near the roadside, while O3 contributes most significantly in rural areas.
TECHNICAL DETAILS
Air quality at any urban location is controlled by many factors, including (1) the release of air pollutants from nearby and far away emission sources (e.g., human related sources like vehicles and ships, power plants, industrial plants, residential and commercial buildings, and natural sources like dust storms and forest fires, etc.) (2) the transportation of pollutants by winds from one place to another, (3) other meteorological factors like temperature, sunshine and rainfall that affect the photo-chemical transformation of the air pollutants enroute, and (4) urban morphology that affects the dispersion and ventilation of the air pollutants in the city.
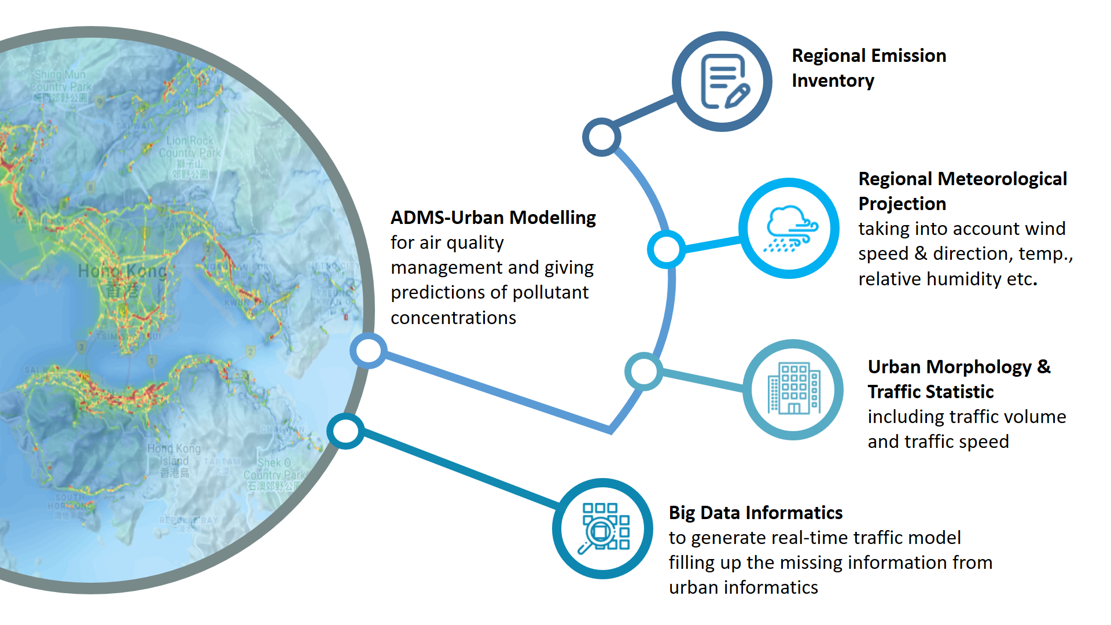
To analyse the current air quality situation, as well as to predict the air quality variations in the next 48 hours, we have to try to take into account of all the aforementioned processes. For the PRAISE-HK system, we have combined multiple state-of-the-science technologies including the most updated emission inventories, land-use characteristics, large-scale coarse resolution weather prediction and photo-chemical air quality models, very fine-scale high resolution urban street canyon model, traffic simulation models, and big data analytics to provide the best short-term analysis and medium-term forecasts of air quality down to individual streets.
The system comprises of the following components:
- BACKGROUND AIR QUALITY – derived using the coupled WRF-CMAQ photo-chemical model with the most up-to-date emission inventory
- HONG KONG AIR QUALITY DISTRIBUTION – derived using the Urban-ADMS model with local urban morphology information (topography, building height and density), traffic statistics, as well as weather and background air quality output from the WRF-CMAQ model
- REAL-TIME VARIATIONS – use big-data analytics to combine air quality prediction from the Urban-ADMS model with real-time wind, air quality and special reports related to changing road/traffic conditions
FAQs
At the moment, no. But we anticipate that, in the future, apps similar to PRAISE-HK will be developed for other cities and regions.
PRAISE-HK is available for both iOS and compatible Android devices running OS 6.0 or higher.
In order to receive real-time air quality and health risk information, you will need to make sure your device is connected to the internet and activated your GPS for greater accuracy.
We are considering the development of a web-based version of PRAISE-HK in the near future.
%AR or the Percentage Added Health Risk” of an air pollutant (e.g. NO2) is a measure of the percentage increase in risk of hospitalization due to that pollutant at the observed level, as compared to the risk of hospitalization if the concentration of that pollutant is zero.
The AQHI is based on the sum of %AR of four pollutants: ozone (O3), nitrogen dioxide (NO2), sulphur dioxide (SO2), and particulate matter (PM).
The %ARs used in PRAISE-HK are derived from time-series analysis of pollution and hospitalization data reported in Hong Kong. These are “short-term” risks because the use of time-series analysis of short-term (daily) variations, as contrasted to other “long-term” risks derived from incidence analysis on long-term (annual-averaged) pollution and mortality or cancer case data.
The primary data for PRAISE-HK is an extensive atmospheric and environmental database developed by IENV at HKUST. Since 1997, this database has been collecting online and offline data related to real-time in-situ and remote-sensed meteorological and environmental observations, urban morphology, population and health statistics, transport patterns (land, sea and air) and other emission source characteristics. These data were used to support the WRF-CMAQ, ADMS-Urban, MATSIM and the big-data analytics modules of the PRAISE-HK system.
See Technical Details for more information.
No, at the moment. But it will happen in the next phase.
The current version of this app is in the Phase 1 of PRAISE-HK project, which allow the user to query the current and predicted outdoor air quality information at a specific location.
The Phase 2 launched in late 2019 will focus on further deducing air quality from indoor and vertical (elevated vs. underground) environments. At this stage, the app will be upgraded with the powerful capability to calculate a user’s daily total exposure based on their daily activities in different locations and at different times.
In 2021, the app released in the third phase will leverage the health information collected from active users to provide personalised health recommendations upon real-time and foreseeable air quality situations.
The release dates may subject to change without prior notice due to the project progress.
The current data provided by the government’s AQHI is based on average pollutant concentration measurements taken from the EPD’s 13 general and three roadside air quality-monitoring stations in different districts, and corresponding short-term health risks.
While this is helpful, the numbers only illustrate a general picture about the air quality situation over a very wide geographical area, but they cannot show the street-to-street variations of air quality.
In contrast, the PRAISE-HK system provide high resolution air quality and health risks information down to the street level. When the air quality is particularly bad, the public can then make more informed decisions to reduce the air pollutant exposure in their daily activities (e.g. avoiding the more polluted streets).
We compare our prediction with corresponding values reported by the Environmental Protection Department’s at their air quality monitoring stations. Here is the verification statistics: http://envf.ust.hk/dataview/v2/praise-verif/current/index.py.
PRAISE-HK is a cross-institutional collaboration. The project has been receiving the support of the Environmental Protection Department, Energizing Kowloon East Office, medical professionals and environmental NGOs.
Please check out http://hqlx56.ust.hk/wordpress/index.php/team/ for a list of supporting organisations.
Please contact PRAISE-HK Team by email to praise@ust.hk.
PRAISE-HK is developed by the Institute for the Environment (IENV) at the Hong Kong University of Science and Technology (HKUST), and it is funded by the HSBC 150th Anniversary Charity Program.